Laser diffraction is one of the worlds most widely used particle size techniques. It can measure wet suspensions, dry powders and sprays from the order of 10’s of nm to the mm scale.
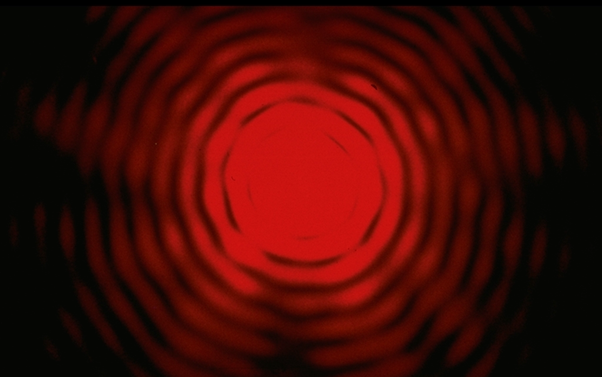
Any laser diffraction system is a box, containing a laser and some detectors designed to measure particle size. The particles are separated in a fluid (liquid or gas) that flows through the laser. As the particles pass through the laser beam, they scatter some of the light, and this light is collected on the detectors. The scattering pattern generally looks like this, with a central spot surrounded by rings of light. The spacing and intensity of the rings is related to the particle size by the optical model.
We know that for large particles, the scattering is through small angles and is very strong.
As particle size decreases, the scattering angle increase and the intensity decreases. This results in a diffuse pattern.
The relationship between the scattering angle and intensity as a function of particle size is described by an optical model called Mie theory. The software uses the optical model to find the particle size distribution from the scattering pattern.
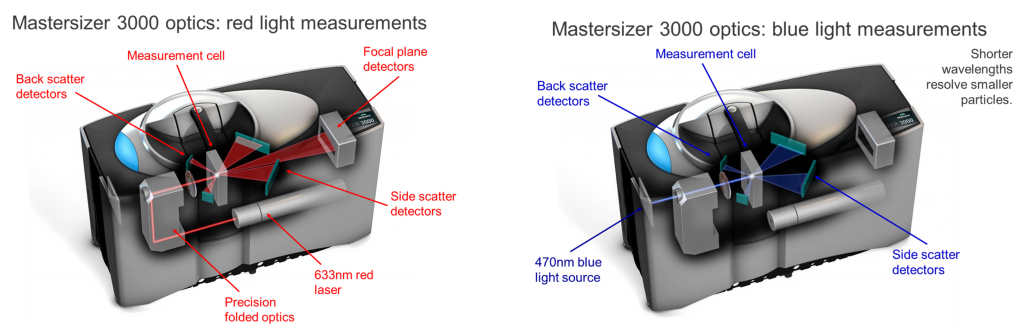
Let’s take a closer look at how laser diffraction measurements are made in the Mastersizer 3000. The red laser light is provided by a 633nm HeNe gas laser which was chosen for its excellent long term stability. The laser beam passes through a precision folded optical arrangement that transports the light through 180 degrees. The beam then passes through the measurement cell where the sample is dispersed. Laser light diffracted or scattered by the sample is captured on a series of detectors situated at a range of angles relative to the main laser beam. Light scattered at small angles, from the larger particles, is collected on the focal plane detectors. Laser light scattered at wider angles, from smaller particles, is collected on a series of side scatter detectors. Finally light scattered at angles greater than 90 degrees, from the smallest particles, is collected on a series of back scatter detectors.
To improve the resolution of particles in the sub-micron region, the Mastersizer 3000 combines measurements made with the red laser and a powerful solid state blue light source (470nm). Light from this source passes through optics and enters the measurement cell at exactly the same angle and position as with the red laser. In the case of the blue light source, since we are only interested in scattering from the smallest particles, scattered light is only measured on the side scatter detectors and the back scatter detectors.
The blue source is used in liquid dispersion measurements of sub-micron particles. It is not available for dry dispersions.
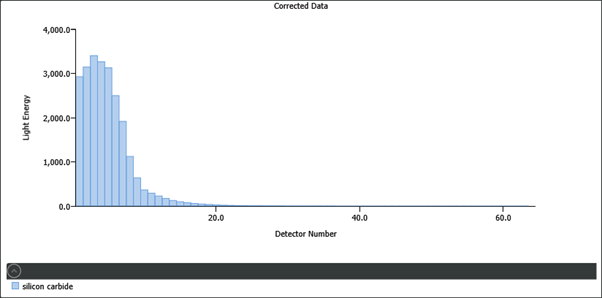
This is a typical scattering pattern from coarse particles. The scattering is concentrated on the first 10 or so detectors and the light energy is very high, peaking at over 3000 units.
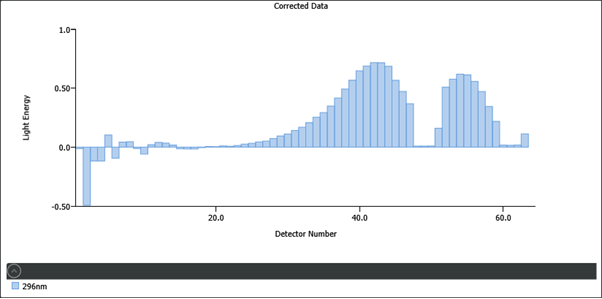
In contrast, this scattering pattern is typical of submicron materials and it looks very different. Most of the scattering has moved to the high number, high angle detectors. There now appear to be two peaks – one for the red light and one for the blue. The scattering intensity is much less, at approximately 1 unit. And as the scattering from the sample is so low, we can see some noise on the small angle channels. On channel 2, the data appears to be negative. This is because we measured the background at one point in time, but there are always small fluctuations so momentarily the background is over subtracted on this channel, leading to the negative data. This is normal for the system.
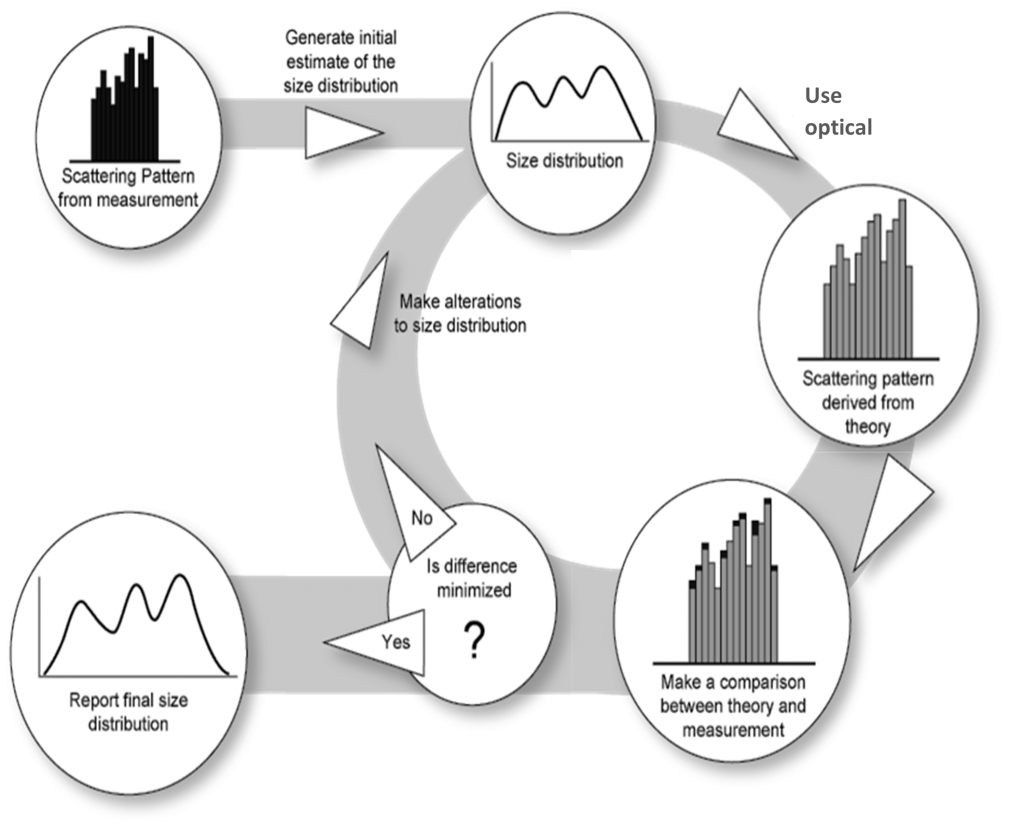
We calculate a size distribution from the scattered light by using an optical model (Mie scattering theory)
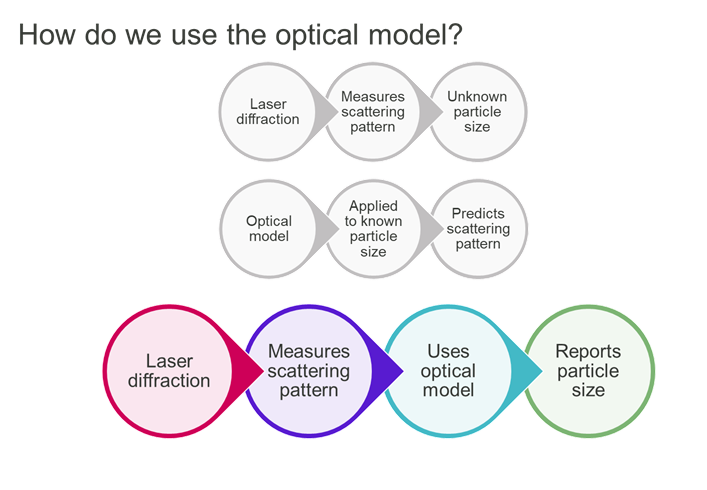
Laser diffraction measures scattered light energy vs angle for samples of unknown size distribution
An optical model can predict the scattering pattern (scattered light energy vs angle) given a known particle size distribution
To obtain a particle size distribution from an unknown sample we must use the optical model as part of an iterative process…
Providing the optical properties to the analysis we end up with the particle size distribution which gave that scattering pattern, but if the optical properties are incorrect, the size distribution will also be incorrect.
Good ness of fit parameters can be used to judge the quality of the measurement.